
Know what your customers really feel, not just what they say.
Our surveys dig deeper into emotions, experiences, and expectations to help you build lasting loyalty and stronger relationships.


Rated by 1K+ Industry leaders
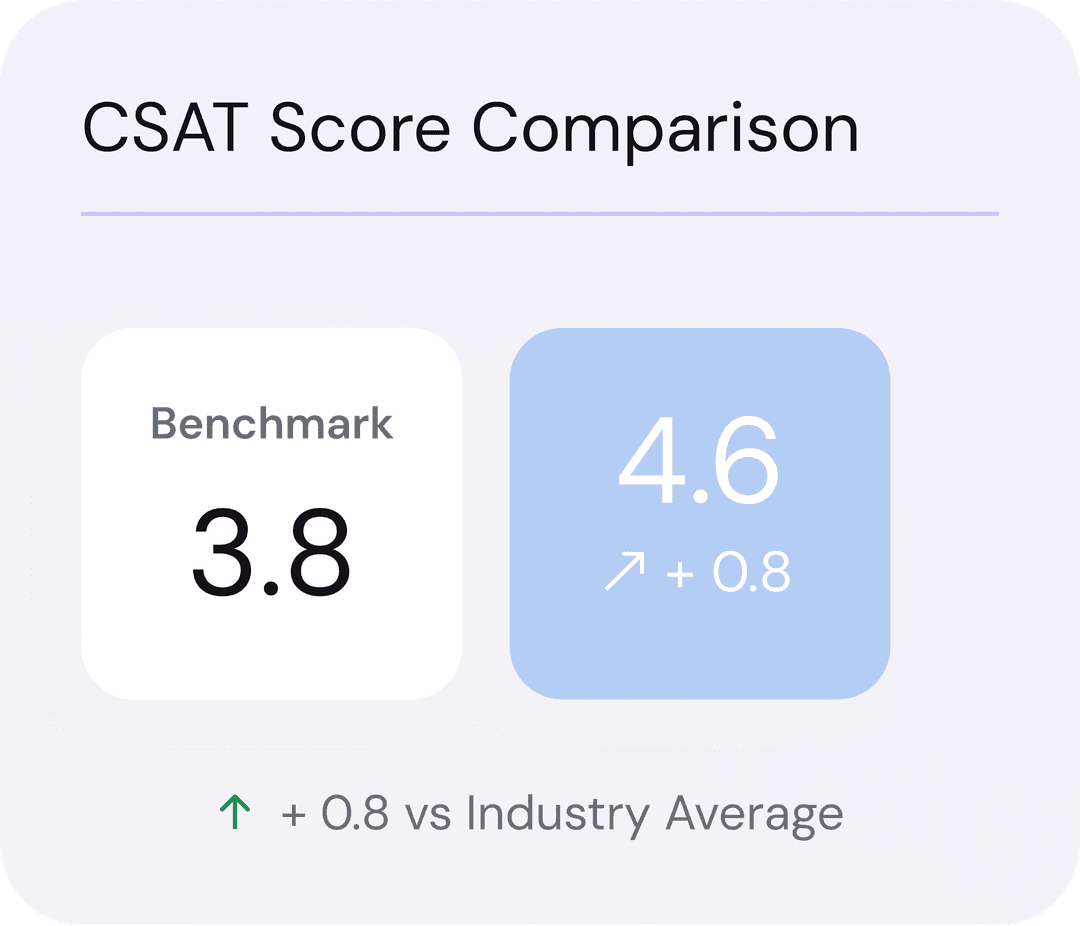
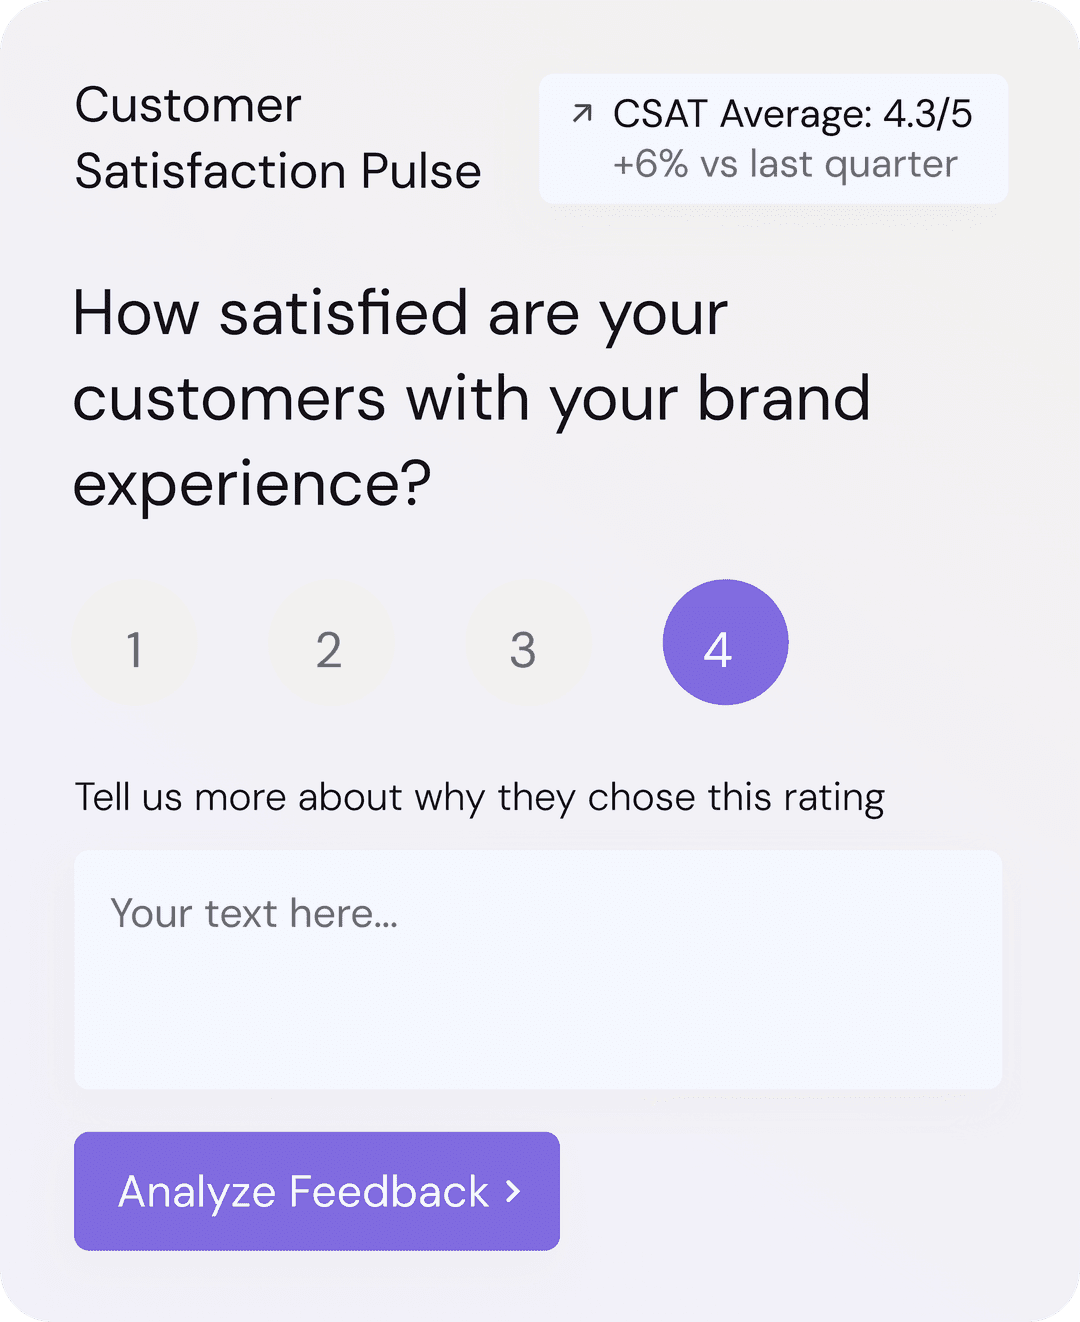
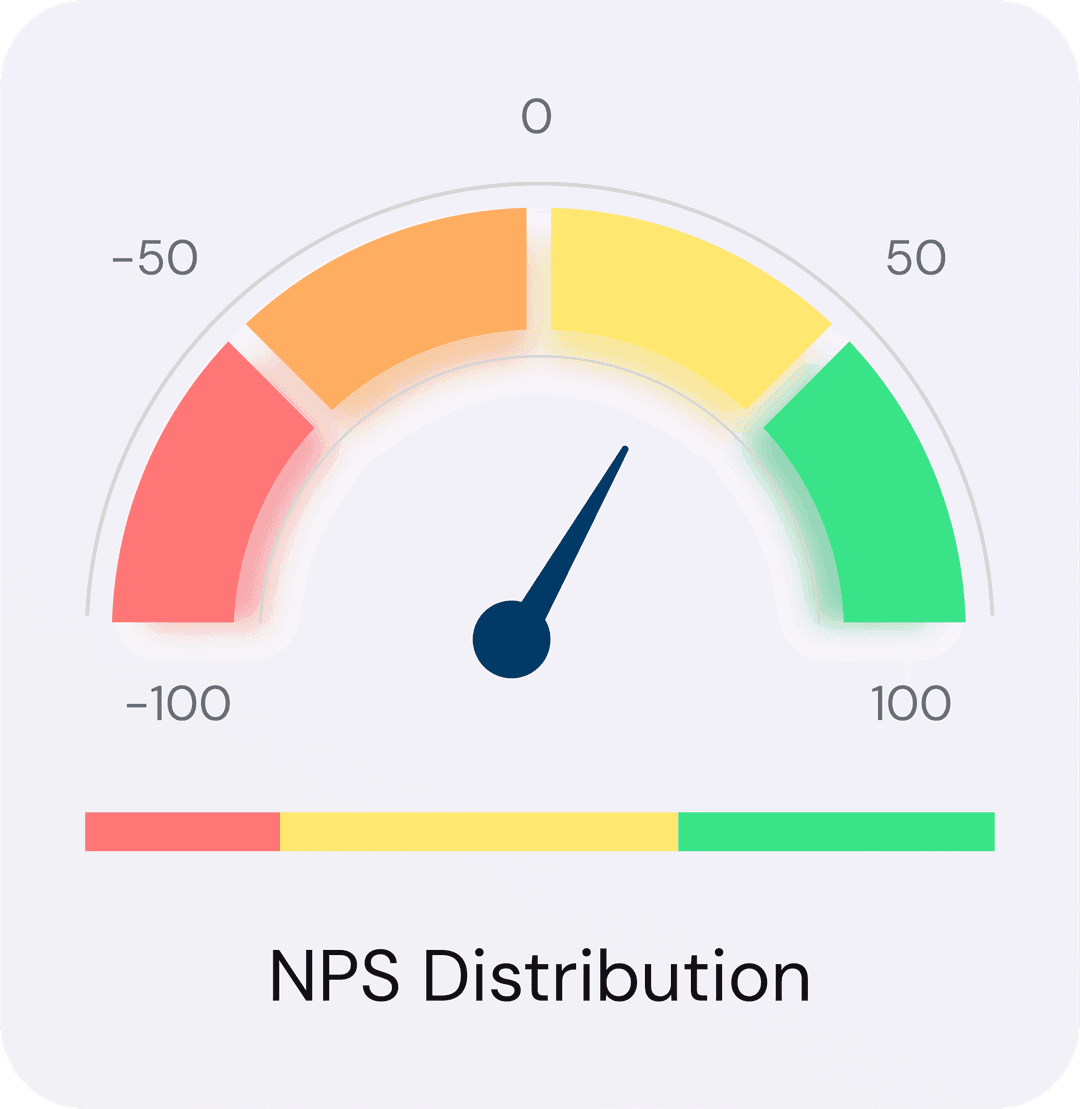
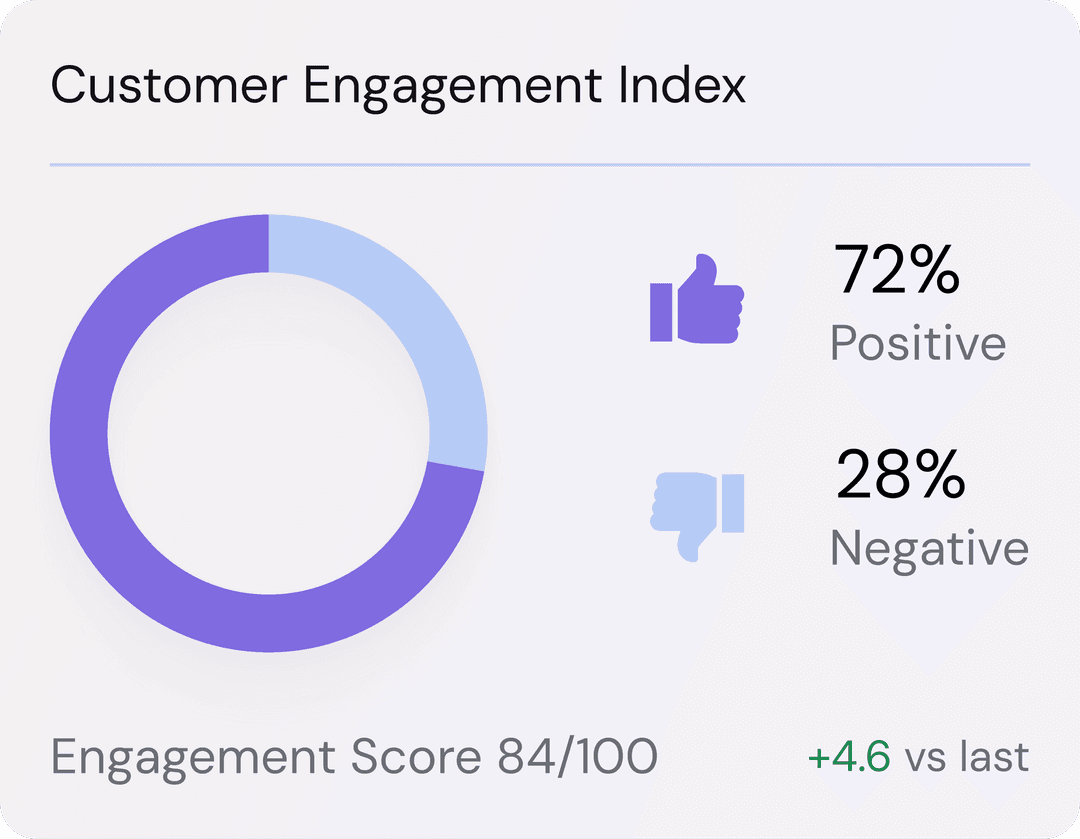
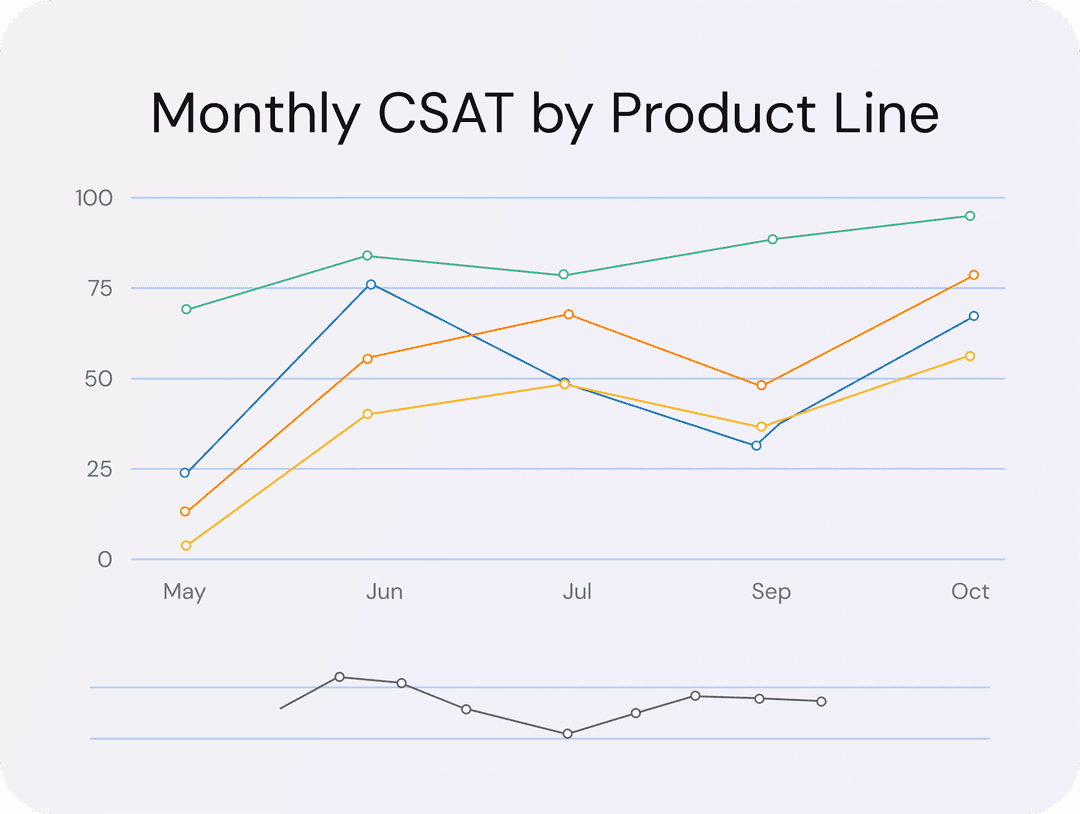
Customer Satisfaction Dashboard


ABOUT KEN SURVEY
Built on Reach, Research, and Real Voices
Use real feedback from real audiences to understand what drives decisions and act with confidence.
0+
Respondents Engaged Across 50+ Markets
0+
Surveys Conducted
0+
Product Managers, CX Leaders & Strategy Heads in Our Network
Our Clients


Whats Impacting Your Customer
Pain points
Problem
Satisfaction scores feel like disconnected numbers with no direction or actionable meaning.
Solution
Transforms raw feedback into clear insights that highlight what truly drives satisfaction.
How We Help You Understand Customers Better
Our approach turns scattered feedback into clear insights, thus helping you take action where it matters most.
Initial Needs Assessment
We begin by understanding your business goals, customer touchpoints, and satisfaction challenges. This helps us define the right metrics and focus areas.
Step 01

Initial Needs Assessment
Survey Design & Customization
Once we understand your objectives, we design surveys that capture both emotion and experience, addressing key drivers like product quality, service efficiency, and brand trust.
Step 02

Survey Design & Customization
Implementation & Data Collection
We deploy surveys across all relevant channels like online, in-app, in-store, or via phone etc, to ensure authentic, diverse, and representative customer feedback.
Step 03

Implementation & Data Collection
Data Analysis & Insight Generation
Our analytics team identifies patterns, satisfaction trends, and root causes behind customer opinions, turning raw responses into actionable insights that matter.
Step 04

Data Analysis & Insight Generation
Strategy Development & Recommendations
Using these insights, we develop focused strategies to improve service quality, customer communication, and overall brand experience, thus helping you close feedback loops faster.
Step 05

Strategy Development & Recommendations
Implementation
We work closely with your teams to put recommendations into action, from training and system updates to process improvements that create visible impact.
Step 06

Implementation
Continuous Tracking & Consultation
As your customers evolve, our insights evolve with them. We provide ongoing consultation, benchmarking, and strategy refinement to help you stay ahead in customer satisfaction and loyalty.
Step 07

Continuous Tracking & Consultation
Initial Needs Assessment
We begin by understanding your business goals, customer touchpoints, and satisfaction challenges. This helps us define the right metrics and focus areas.
Step 01
Initial Needs Assessment
Survey Design & Customization
Once we understand your objectives, we design surveys that capture both emotion and experience, addressing key drivers like product quality, service efficiency, and brand trust.
Step 02
Survey Design & Customization
Implementation & Data Collection
We deploy surveys across all relevant channels like online, in-app, in-store, or via phone etc, to ensure authentic, diverse, and representative customer feedback.
Step 03
Implementation & Data Collection
Data Analysis & Insight Generation
Our analytics team identifies patterns, satisfaction trends, and root causes behind customer opinions, turning raw responses into actionable insights that matter.
Step 04
Data Analysis & Insight Generation
Strategy Development & Recommendations
Using these insights, we develop focused strategies to improve service quality, customer communication, and overall brand experience, thus helping you close feedback loops faster.
Step 05
Strategy Development & Recommendations
Implementation
We work closely with your teams to put recommendations into action, from training and system updates to process improvements that create visible impact.
Step 06
Implementation
Continuous Tracking & Consultation
As your customers evolve, our insights evolve with them. We provide ongoing consultation, benchmarking, and strategy refinement to help you stay ahead in customer satisfaction and loyalty.
Step 07
Continuous Tracking & Consultation
What Makes Our Way Different
01
Industry-Specific Intelligence
Industry-Specific Intelligence
We cusotmize every survey to your sector, from BFSI and retail to automotive and healthcare, aligning questions with customer journeys and market expectations.
02
Emotion & Sentiment Analytics
Emotion & Sentiment Analytics
We go beyond CSAT scores, using text and emotion analytics to uncover the true drivers of satisfaction, frustration, and loyalty.
03
Integrated Research Consulting
Integrated Research Consulting
We merge primary feedback with market intelligence, connecting survey insights with behavior, competition, and trends for a complete 360° view.
04
Intelligent Dashboards & Automation
Intelligent Dashboards & Automation
Our dashboards offer real-time visibility into satisfaction, NPS, and churn, powered by automated pipelines and customizable KPIs.
05
Multi-Channel Data Collection
Multi-Channel Data Collection
From email and web to WhatsApp and IVR, our omnichannel setup boosts response rates and ensures accurate customer representation.
06
Benchmarking & Predictive Analysis
Benchmarking & Predictive Analysis
We benchmark your performance and predict future trends, using regression models to identify risk points before they affect retention.
07
Actionable Strategy Playbooks
Actionable Strategy Playbooks
Each survey delivers a clear roadmap, translating insights into actions for better experiences and operational improvement.
08
Continuous Monitoring & Consultation
Continuous Monitoring & Consultation
We provide ongoing reviews, refining metrics and strategies to match your customers’ evolving expectations.
09
Global Reach, Local Precision
Global Reach, Local Precision
Across 80+ markets, we combine global best practices with local understanding for accurate, culturally relevant insights.
Our Impact
Real examples of how data and our strategies shaped stronger brands.
What Our Clients Say
FAQs
How do I know if poor CSAT is hurting my revenue or if it’s just a “soft metric”?
We correlate CSAT with real business indicators including:
- Repeat purchase rate
- Refund patterns
- Ticket escalation trends
- Churn risk signals
- Lead-to-conversion movement
If dissatisfaction consistently aligns with negative commercial outcomes, CSAT becomes a hard metric with direct revenue impact, not a soft one.
How fast can a CSAT survey show if a new change is working or not?
Modern CSAT systems are trigger-based, capturing immediate reactions to:
- New UI changes
- Policy revisions
- Support process updates
- Pricing adjustments
- New product features
This allows rapid course correction before issues compound.
Can CSAT help me find the exact touchpoint where customer experience breaks?
Yes. CSAT is most powerful when linked to specific customer events.
We map satisfaction across the entire journey:
- Browsing
- Checkout
- Delivery
- Onboarding
- Support tickets
- Usage experience
A touchpoint heatmap highlights where dissatisfaction clusters.
How is CSAT different from customer feedback we already collect on social media, Google reviews, or support chats?
External feedback is reactive and unstructured. CSAT is proactive, structured, and diagnostic.
CSAT provides:
- Consistent measurement
- Comparative trends
- Segment-level clarity
- Root-cause attribution
It converts scattered noise into actionable customer intelligence.
Can a CSAT survey help me improve customer onboarding or adoption?
Yes. Onboarding is one of the clearest satisfaction indicators.
CSAT identifies where:
- Customers feel stuck
- Information is unclear
- Features aren’t intuitive
- Navigation is confusing
- Support isn’t accessible
Fixing onboarding friction quickly boosts adoption and retention.
Can CSAT insights help improve retention strategy?
Absolutely. Retention failures usually begin as early dissatisfaction signals visible in CSAT data.
We highlight:
- Churn-risk segments
- High-friction touchpoints
- Negative sentiment clusters
- Declining satisfaction patterns
This allows you to address dissatisfaction long before retention drops.
What does a modern CSAT dashboard look like?
A consulting-grade CSAT dashboard includes:
- Overall satisfaction trends
- Touchpoint-level scores
- Segment insights
- Driver impact mapping
- Negative sentiment clusters
- Key root causes
- Improvement priorities
- Recommended action steps
It’s designed for executive-level decision-making.
How do you link CSAT to revenue impact?
We correlate satisfaction patterns with:
- Purchase frequency
- Conversion rates
- Repeat buying
- Customer lifetime value
- Refunds and escalations
- Support cost patterns
This clearly demonstrates the commercial value of improving customer satisfaction.

Explore Other Surveys
Employee Engagement Surveys
Understand how your people feel, what keeps them motivated, and what they need to do their best every day.
Dealer’s Voice Surveys
Get honest feedback from your channel partners to build stronger relationships and smoother operations.
Customer Demand, Needs & Pain Point Surveys
Find out what your customers really want next and how you can make their experience better.
Brand Perception Surveys
See your brand through your audience’s eyes and understand how they think, feel, and connect with it.