


USA Polylactic Acid PLA Market Outlook to 2030
Region:North America
Author(s):Meenakshi
Product Code:KROD3083
October 2024
84
About the Report
USA Polylactic Acid PLA Market Overview
- The USA Polylactic Acid (PLA) Market is valued at USD 630 million, based on a five-year historical analysis. The primary drivers of this growth include the rising demand for bio-based plastics due to increasing environmental concerns and the ongoing push for sustainability across industries such as packaging, automotive, and consumer goods. The adoption of PLA in various sectors stems from its biodegradability and potential to reduce the carbon footprint, as industries shift from petrochemical-based plastics to bio-based alternatives.
- The market is primarily dominated by regions like the Midwest and West Coast. The Midwest leads due to its proximity to abundant agricultural resources like corn, a primary feedstock for PLA production, while the West Coast excels due to high sustainability awareness and the presence of key industries such as packaging and electronics, which heavily invest in eco-friendly materials. These regions benefit from favorable policies and regulatory frameworks promoting bio-based alternatives, further propelling their dominance in the market.
- Government incentives for sustainable packaging have grown in the U.S., creating a favorable environment for this market. Various subsidies and tax breaks are now available for businesses transitioning to eco-friendly packaging materials, including PLA. Initiatives like the Green Packaging Initiative have further encouraged companies to adopt PLA across industries. Additionally, collaborations between the federal government and industry stakeholders are focusing on streamlining recycling processes for PLA-based products, making sustainable packaging solutions more cost-effective and reducing overall waste management challenges.
USA Polylactic Acid PLA Market Segmentation
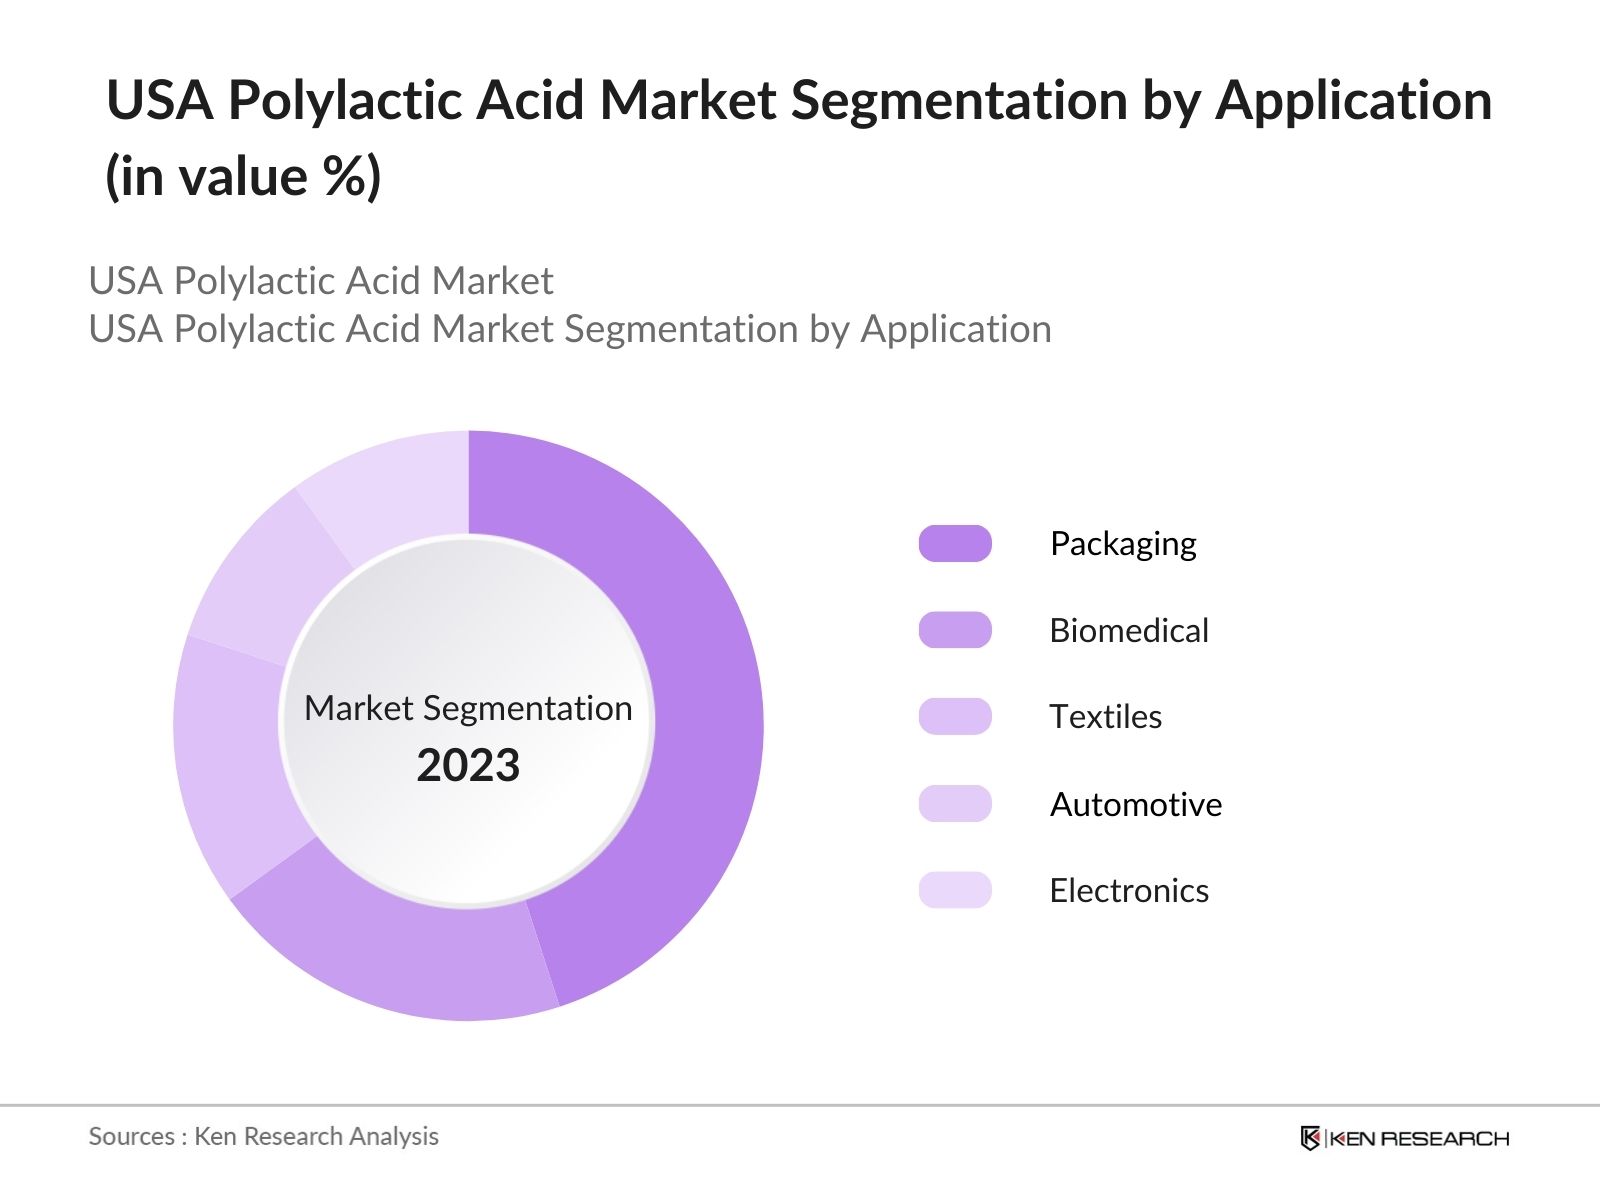
By Application: The USA PLA market is segmented by application into packaging, biomedical, textiles, automotive, and electronics. Packaging, specifically in food and beverages, holds a dominant market share due to the increasing demand for sustainable packaging solutions. The shift towards environmentally-friendly materials and consumer awareness about reducing plastic waste has strengthened the demand for PLA-based packaging. Companies in the food industry are replacing traditional plastics with PLA to meet regulatory requirements and enhance brand value by associating with eco-friendly initiatives.
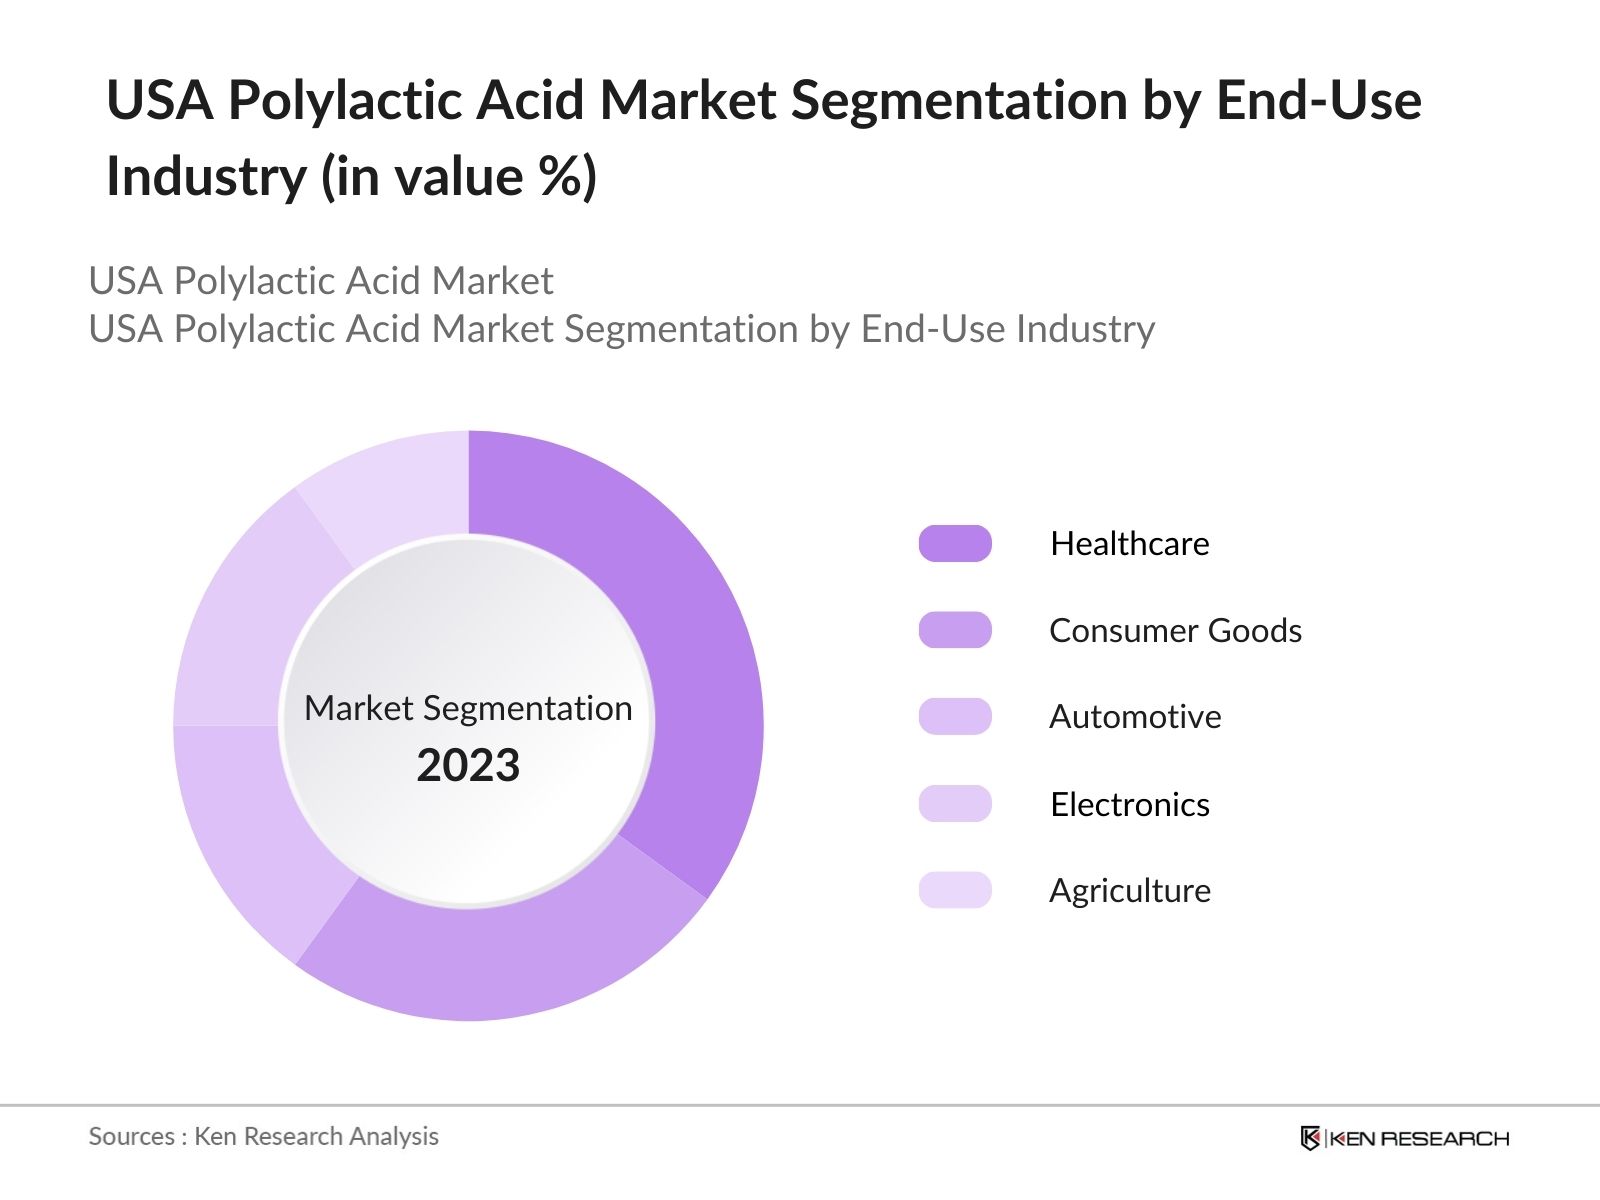
By End-Use Industry: The USA PLA market is also segmented by end-use industries into healthcare, consumer goods, automotive, electronics, and agriculture. The healthcare sector commands a significant portion of the market share due to the increased adoption of PLA in biomedical applications such as sutures, stents, and drug delivery systems. PLAs biocompatibility and biodegradability make it highly suitable for these applications, which is further supported by technological advancements in the medical field, promoting its usage in a variety of medical devices and components.
USA Polylactic Acid PLA Market Competitive Landscape
The market is dominated by a few key players that maintain significant influence due to their extensive production capacities and strong focus on innovation in bioplastics. The market is consolidated, with major global and regional manufacturers investing heavily in research and development to improve PLAs properties and increase its application across various industries. Companies like NatureWorks, Total Corbion PLA, and BASF SE are at the forefront of these efforts, enhancing their competitive edge through strategic partnerships and expansions.
|
Company Name |
Established |
Headquarters |
Production Capacity |
Research & Development Focus |
Sustainability Initiatives |
Major Clients |
Product Portfolio |
Recent Investments |
|
NatureWorks LLC |
1997 |
Blair, Nebraska |
||||||
|
Total Corbion PLA |
2017 |
Gorinchem, Netherlands |
||||||
|
BASF SE |
1865 |
Ludwigshafen, Germany |
||||||
|
Danimer Scientific |
2004 |
Bainbridge, Georgia |
||||||
|
Corbion N.V. |
1919 |
Amsterdam, Netherlands |
USA Polylactic Acid PLA Industry Analysis
Growth Drivers
- Regulatory support for biodegradable plastics: The U.S. regulatory landscape is increasingly supporting biodegradable plastics, such as PLA, to curb plastic waste. The Plastic Waste Management (Amendment) Rules, 2024 emphasize stricter regulations for managing plastic waste, supporting the transition to biodegradable and compostable plastics. It mandates producers to obtain certifications from the Central Pollution Control Board for compostable plastics and imposes responsibility on local bodies to manage plastic waste. These amendments drive the demand for biodegradable materials like PLA, aligning with the U.S.'s regulatory efforts toward sustainable waste management.
- Growth in bioplastics for packaging: The packaging sector is experiencing significant growth in the use of bioplastics like PLA for sustainable packaging solutions, driven by policies focused on reducing single-use plastics. Government regulations, including the EPAs National Recycling Strategy launched in November 2021, are encouraging the shift towards biodegradable materials. This strategy aims to boost the recycling rate by 50% by 2030, further supporting the adoption of eco-friendly alternatives as companies prioritize sustainable packaging options.
- Demand for sustainable materials: The demand for sustainable materials like PLA is rising in the USA due to increasing environmental awareness. Biodegradable alternatives, including PLA, are favored due to their compostable nature, aligning with policies aimed at reducing plastic waste. Regulatory frameworks such as the Break Free from Plastic Pollution Act are driving this transition. PLA, which is derived from renewable resources like corn and sugarcane, is playing a significant role in reducing reliance on traditional plastics, particularly in packaging and other applications where sustainability is a priority.
Market Restraints
- High production costs: PLA production costs continue to be a challenge, limiting its widespread adoption in the U.S. The production process, which involves extracting sugars from feedstocks like corn and sugarcane, is energy-intensive. Additionally, PLA lacks the economies of scale enjoyed by petroleum-based plastics, further widening the cost gap. Although regulatory support encourages the shift toward bioplastics, the high cost of raw materials and complex production processes remain significant barriers to more extensive industry growth.
- Limited feedstock availability: The availability of corn and sugarcane, essential feedstocks for PLA production, is subject to fluctuations in agricultural output. Weather conditions and competing demands for these crops in the food industry can limit their availability for bioplastic manufacturing, leading to production volatility. This can further impact pricing and supply chains, making it difficult to maintain a steady flow of raw materials for PLA production.
USA Polylactic Acid PLA Market Future Outlook
Over the next five years, the USA Polylactic Acid (PLA) market is expected to witness robust growth driven by increasing demand for eco-friendly materials, technological advancements in PLA production, and favorable government policies. The expansion of PLAs use across new sectors such as electronics and automotive, alongside the growing shift towards sustainable packaging solutions, will further propel market growth. Investments in bioplastics manufacturing capabilities and the adoption of circular economy principles will be critical in shaping the future of the PLA industry in the USA.
Market Opportunities
- Technological advancements in PLA production: Recent innovations in PLA production technologies are enhancing efficiency and reducing costs. Advancements include energy-efficient fermentation processes and improved catalyst technologies, which streamline the polymerization of PLA. These developments are helping make PLA production more scalable and economically viable, opening up possibilities for larger commercial applications. Reducing energy and resource consumption in the manufacturing process further boosts PLA's potential as a sustainable alternative to traditional plastics.
- Expansion into automotive and electronics sectors: PLA is increasingly being adopted in the automotive and electronics industries, offering new market opportunities. Its biodegradable and non-toxic properties make it an attractive material for components in vehicles and electronics. The versatility of PLA has led to its growing use in non-structural parts, such as interior components and casings, where sustainability is becoming a key focus for manufacturers. This expansion is expected to drive further growth in the PLA market.
Scope of the Report
Products
Key Target Audience
PLA Manufacturers Companies
Healthcare Device Companies
Automotive Component Suppliers
Packaging Material Suppliers Companies
Electronics Manufacturers Companies
Investments and Venture Capitalist Firms
Government and Regulatory Bodies (U.S. Environmental Protection Agency, USDA)
Companies
Major Players
NatureWorks LLC
BASF SE
Total Corbion PLA
Danimer Scientific
Corbion N.V.
Synbra Technology
Futerro
DuPont
Toray Industries Inc.
Teijin Limited
Mitsubishi Chemical Holdings Corporation
Toyobo Co., Ltd.
Evonik Industries AG
Arkema S.A.
Unitika Ltd.
Table of Contents
1.USA Polylactic Acid (PLA) Market Overview
1.1. Definition and Scope
1.2. Market Taxonomy
1.3. Market Growth Rate (Bio-based plastic demand, Sustainability regulations)
1.4. Market Segmentation Overview
2. USA Polylactic Acid (PLA) Market Size (In USD Mn)
2.1. Historical Market Size
2.2. Year-on-Year Growth Analysis (Driven by eco-friendly packaging, bioplastics in medical applications)
2.3. Key Market Developments and Milestones (Adoption by consumer goods, innovations in polymer blends)
3. USA Polylactic Acid (PLA) Market Analysis
3.1. Growth Drivers
3.1.1. Demand for sustainable materials
3.1.2. Growth in bioplastics for packaging
3.1.3. Regulatory support for biodegradable plastics
3.1.4. PLA's versatile applications in automotive and electronics
3.2. Market Restraints
3.2.1. High production costs
3.2.2. Limited feedstock availability (corn, sugarcane)
3.2.3. Competition with other biopolymers
3.3. Opportunities
3.3.1. Technological advancements in PLA production
3.3.2. Expansion into automotive and electronics sectors
3.3.3. Increasing usage in biomedical applications
3.4. Trends
3.4.1. Growth in flexible PLA packaging solutions
3.4.2. Integration of PLA with nanocomposites
3.4.3. Use of PLA in 3D printing technologies
3.5. Government Regulations (Biodegradable product regulations, incentives for sustainable packaging)
3.6. SWOT Analysis
3.7. Stakeholder Ecosystem (Supply chain dynamics, collaboration opportunities)
3.8. Porter’s Five Forces (Supplier power, buyer power, barriers to entry, substitutes, industry rivalry)
3.9. Competition Ecosystem (Bio-based plastics, biodegradable polymers)
4. USA Polylactic Acid (PLA) Market Segmentation
4.1. By Application (In Value %)
4.1.1. Packaging (Food, Beverage, Consumer Goods)
4.1.2. Biomedical (Sutures, Drug Delivery Systems)
4.1.3. Textiles (Fiber, Nonwoven Fabrics)
4.1.4. Automotive (Interior Parts, Components)
4.1.5. Electronics (Casings, Devices)
4.2. By End-Use Industry (In Value %)
4.2.1. Healthcare
4.2.2. Consumer Goods
4.2.3. Automotive
4.2.4. Electronics
4.2.5. Agriculture
4.3. By Raw Material (In Value %)
4.3.1. Corn-based PLA
4.3.2. Sugarcane-based PLA
4.3.3. Cassava-based PLA
4.4. By Form (In Value %)
4.4.1. Fibers
4.4.2. Films
4.4.3. Sheets
4.4.4. Pellets
4.5. By Region (In Value %)
4.5.1. Northeast
4.5.2. Midwest
4.5.3. Southeast
4.5.4. West
4.5.5. Southwest
5. USA Polylactic Acid (PLA) Market Competitive Analysis
5.1. Detailed Profiles of Major Companies
5.1.1. NatureWorks LLC
5.1.2. BASF SE
5.1.3. Corbion N.V.
5.1.4. Total Corbion PLA
5.1.5. Danimer Scientific
5.1.6. Synbra Technology
5.1.7. Futerro
5.1.8. DuPont
5.1.9. Toray Industries Inc.
5.1.10. Teijin Limited
5.1.11. Mitsubishi Chemical Holdings Corporation
5.1.12. Toyobo Co., Ltd.
5.1.13. Evonik Industries AG
5.1.14. Arkema S.A.
5.1.15. Unitika Ltd.
5.2. Cross Comparison Parameters (Product Portfolio, Sustainability Initiatives, Production Capacity, Key Markets)
5.3. Market Share Analysis
5.4. Strategic Initiatives
5.5. Mergers and Acquisitions
5.6. Investment Analysis
5.7. Venture Capital Funding
5.8. Government Grants and Subsidies
5.9. Private Equity Investments
6. USA Polylactic Acid (PLA) Market Regulatory Framework
6.1. Environmental Standards (Biodegradability, Compostability)
6.2. Compliance Requirements (Food Contact Standards, Recycling Guidelines)
6.3. Certification Processes (USDA BioPreferred Program, EN 13432)
7. USA Polylactic Acid (PLA) Future Market Size (In USD Mn)
7.1. Future Market Size Projections
7.2. Key Factors Driving Future Market Growth (Adoption of PLA in packaging, automotive, and medical sectors)
8. USA Polylactic Acid (PLA) Future Market Segmentation
8.1. By Application (In Value %)
8.2. By End-Use Industry (In Value %)
8.3. By Raw Material (In Value %)
8.4. By Form (In Value %)
8.5. By Region (In Value %)
9. USA Polylactic Acid (PLA) Market Analysts' Recommendations
9.1. TAM/SAM/SOM Analysis
9.2. Customer Cohort Analysis
9.3. Marketing Initiatives
9.4. White Space Opportunity Analysis
Research Methodology
Step 1: Identification of Key Variables
The initial phase involves constructing a stakeholder ecosystem for the USA Polylactic Acid (PLA) Market, supported by extensive desk research using secondary databases. The aim is to identify critical variables like production capacity, feedstock availability, and industry demand that influence market dynamics.
Step 2: Market Analysis and Construction
Historical data on PLA production, usage trends in end-use industries, and sector-wise demand are compiled. This involves assessing key growth drivers, challenges, and opportunities, along with the market's penetration in sectors like packaging and biomedical.
Step 3: Hypothesis Validation and Expert Consultation
Industry experts from major PLA manufacturers and relevant sectors are consulted via phone interviews and surveys to validate hypotheses, refine market estimates, and assess emerging trends. This includes gaining insights into new product developments, investments, and consumer preferences.
Step 4: Research Synthesis and Final Output
A synthesis of findings is completed, including insights from industry stakeholders and verified market statistics. The final report delivers an in-depth and comprehensive view of the USA PLA market, incorporating a bottom-up approach to validate revenue projections and market segmentation.
Frequently Asked Questions
01. How big is the USA Polylactic Acid (PLA) Market?
The USA Polylactic Acid (PLA) market was valued at USD 630 million, driven by the increasing adoption of bio-based plastics across industries such as packaging, healthcare, and automotive.
02. What are the challenges in the USA Polylactic Acid (PLA) Market?
Challenges in the USA PLA market include high production costs, limited feedstock availability (mainly corn), and competition with other biopolymers like PHA and PBAT.
03. Who are the major players in the USA Polylactic Acid (PLA) Market?
Key players in the USA PLA market include NatureWorks LLC, BASF SE, Total Corbion PLA, Danimer Scientific, and Corbion N.V., all of which dominate due to their high production capacities and extensive R&D investments.
04. What are the growth drivers of the USA Polylactic Acid (PLA) Market?
Growth drivers in USA PLA Market include rising demand for sustainable and biodegradable materials, regulatory support for bio-based plastics, and technological advancements in PLA production, particularly for packaging and biomedical applications.
Why Buy From Us?
 Framework")
What makes us stand out is that our consultants follows Robust, Refine and Result (RRR) methodology. i.e. Robust for clear definitions, approaches and sanity checking, Refine for differentiating respondents facts and opinions and Result for presenting data with story

We have set a benchmark in the industry by offering our clients with syndicated and customized market research reports featuring coverage of entire market as well as meticulous research and analyst insights.

While we don't replace traditional research, we flip the method upside down. Our dual approach of Top Bottom & Bottom Top ensures quality deliverable by not just verifying company fundamentals but also looking at the sector and macroeconomic factors.

With one step in the future, our research team constantly tries to show you the bigger picture. We help with some of the tough questions you may encounter along the way: How is the industry positioned? Best marketing channel? KPI's of competitors? By aligning every element, we help maximize success.

Our report gives you instant access to the answers and sources that other companies might choose to hide. We elaborate each steps of research methodology we have used and showcase you the sample size to earn your trust.

If you need any support, we are here! We pride ourselves on universe strength, data quality, and quick, friendly, and professional service.