


USA Salt Market Outlook to 2028
Region:North America
Author(s):Paribhasha Tiwari
Product Code:KROD9154
December 2024
85
About the Report
USA Salt Market Overview
- The U.S. Salt Market is valued at USD 4.15 billion, based on a comprehensive five-year historical analysis. The market is driven by the diverse applications of salt in industries such as food processing, de-icing, chemical manufacturing, and water treatment. Increasing demand for packaged and processed food has significantly boosted consumption. Additionally, government investments in infrastructure and the usage of salt for snow and ice removal have further augmented its demand.
- The Midwest and Northeast regions dominate the U.S. Salt Market due to their harsh winters, which necessitate substantial usage of salt for de-icing. Additionally, states like Michigan and Ohio have abundant natural salt deposits, supporting mining activities and local production. Coastal states also contribute to the market with high demand for salt in chemical industries and food processing.
- The U.S. government has allocated $1.2 trillion for infrastructure development, including road maintenance and expansion. This investment is expected to increase the demand for de-icing salt during winter months, supporting the salt industry's growth.

USA Salt Market Segmentation
By Product Type: The U.S. Salt Market is segmented by product type into rock salt, solar salt, vacuum pan salt, and brine. Recently, rock salt has a dominant market share under this segmentation. This is attributed to its extensive use in de-icing applications, particularly in the northern regions of the country during winter. Its availability and cost-effectiveness make it a preferred choice for municipalities and transportation authorities.

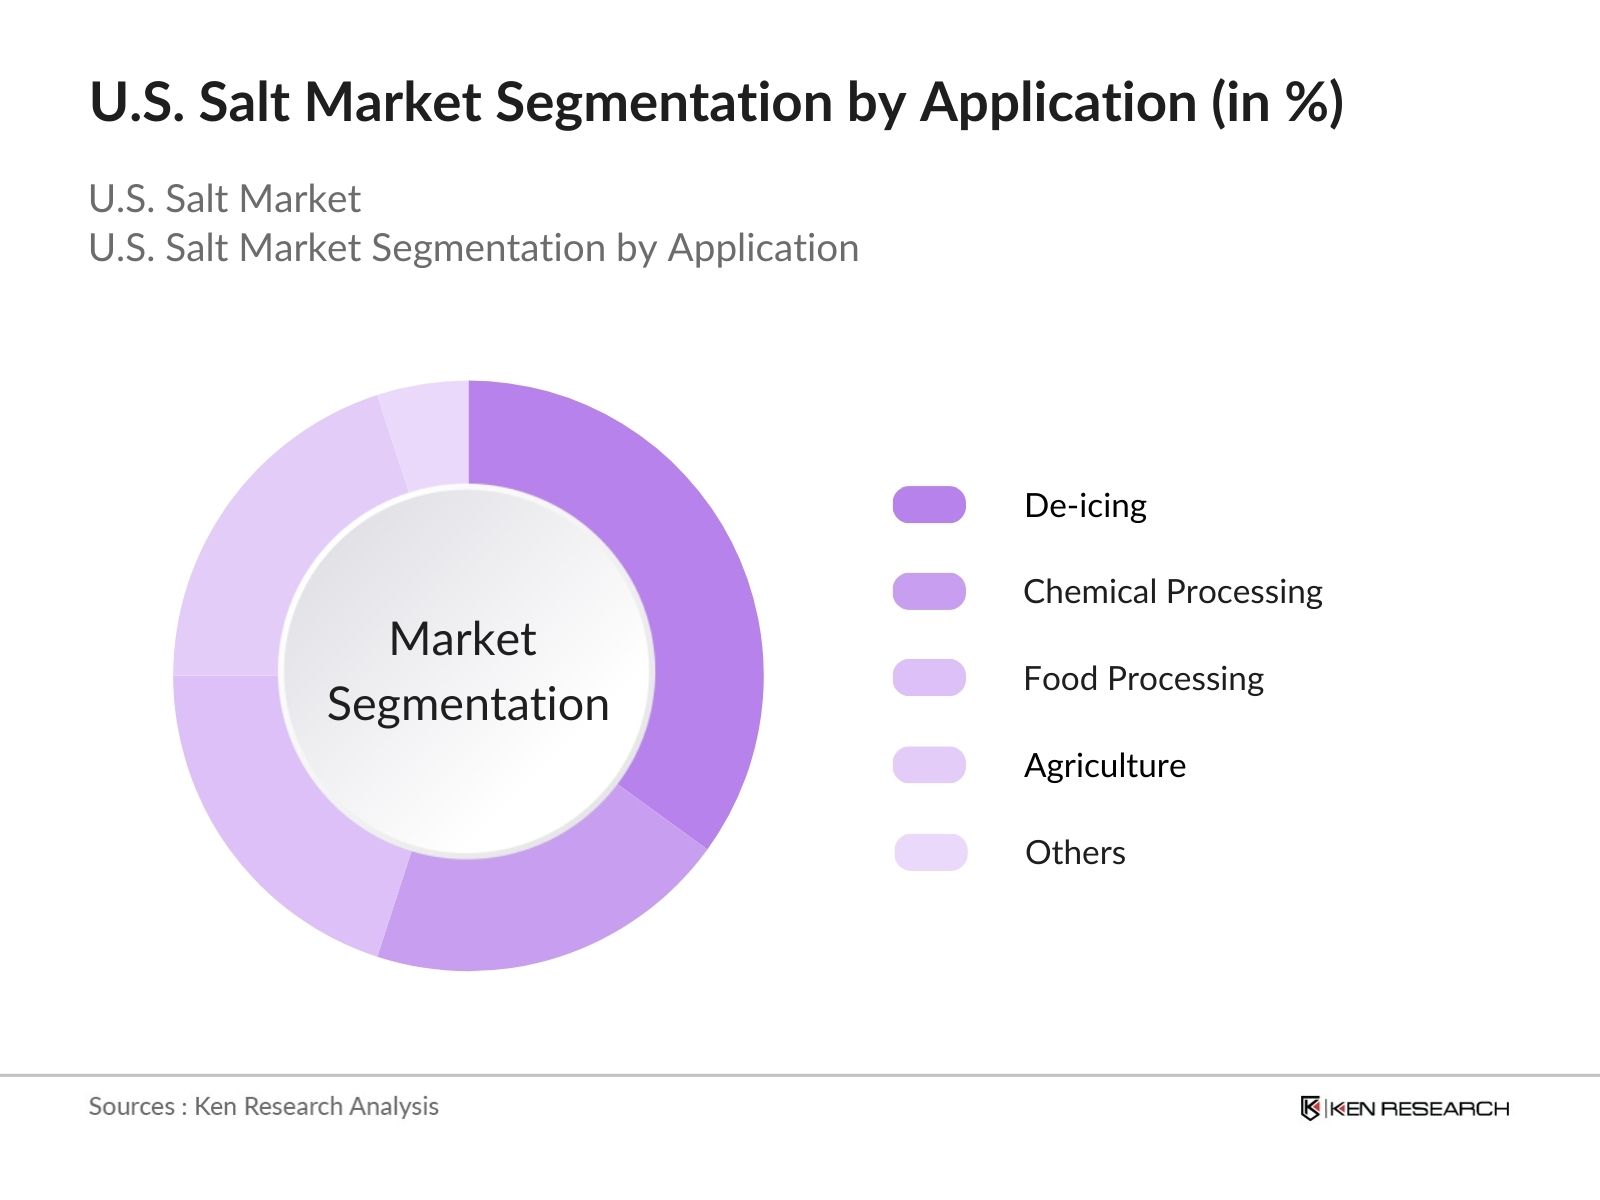
By Application: The U.S. Salt Market is segmented by application into chemical processing, de-icing, food processing, agriculture, water treatment, oil & gas, and others. De-icing dominates the market due to its seasonal yet critical role in ensuring road safety during winters. The widespread use of salt for snow and ice removal, particularly in the Midwest and Northeast, accounts for this segments leading position.
USA Salt Market Competitive Landscape
The U.S. Salt Market is dominated by several major players with established operations across the country. These companies leverage abundant natural resources, advanced production technologies, and strategic partnerships to maintain their market position.

USA Salt Market Analysis
Growth Drivers
- Industrial Applications (Chemical Processing, De-icing): In 2023, the U.S. salt market was valued at $4.12 billion, with significant demand from chemical processing and de-icing applications. The chemical industry utilizes salt extensively in the production of chlorine, caustic soda, and soda ash, which are foundational chemicals for various manufacturing processes. Additionally, during winter months, approximately 20 million tons of salt are used annually for de-icing roads, ensuring public safety and maintaining transportation infrastructure.
- Food Industry Demand: The food industry remains a substantial consumer of salt, employing it as a preservative, flavor enhancer, and in various processing techniques. In 2023, the U.S. food processing sector utilized over 1.5 million tons of salt, reflecting its critical role in product formulation and preservation. This consistent demand underscores the importance of salt in maintaining food quality and safety standards.
- Agricultural Uses: Salt is integral to animal nutrition and feed formulations. In 2023, the U.S. agricultural sector consumed approximately 1 million tons of salt for livestock feed, aiding in the health and productivity of animals. This application supports the broader agricultural economy by ensuring optimal livestock development.
Market Challenges
- Environmental Regulations: Stringent environmental regulations have been implemented to address the ecological impact of salt usage, particularly in de-icing applications. Excessive salt runoff can lead to soil degradation and water contamination, prompting regulatory bodies to enforce limits on salt application rates and promote alternative de-icing methods. Compliance with these regulations necessitates additional costs and operational adjustments for industries reliant on salt.
- Fluctuating Raw Material Costs: The cost of raw materials for salt production, including energy and transportation, has experienced volatility. For instance, in 2023, transportation costs increased by 10%, directly affecting the overall production expenses for salt manufacturers. Such fluctuations can impact profit margins and pricing strategies within the market.
USA Salt Market Future Outlook
Over the next five years, the U.S. Salt Market is anticipated to grow steadily, driven by advancements in mining and production technologies, increasing demand for specialty salts, and expanding applications in water treatment and the chemical industry. Rising environmental concerns may lead to the adoption of more sustainable mining practices and eco-friendly de-icing solutions.
Market Opportunities
- Technological Advancements in Production: The adoption of advanced mining and processing technologies has the potential to enhance efficiency and reduce environmental impact. For example, implementing solar evaporation techniques in salt production can lower energy consumption by up to 50%, offering both economic and environmental benefits.
- Expansion into Emerging Applications: Innovative uses of salt are being explored in sectors such as pharmaceuticals and renewable energy storage. In 2023, the pharmaceutical industry utilized approximately 500,000 tons of high-purity salt in various formulations, indicating a growing niche market. Additionally, molten salt technology is being developed for thermal energy storage in solar power plants, presenting new avenues for market expansion.
Scope of the Report
|
By Product Type |
Rock Salt |
|
By Application |
Chemical Processing |
|
By Source |
Brine |
|
By Distribution Channel |
Direct Sales |
|
By Region |
Northeast |
Products
Key Target Audience
- Salt Manufacturers
- Industrial Users (Chemical and Water Treatment Industries)
- Food Processing Companies
- De-icing and Road Safety Departments
- Government and Regulatory Bodies (e.g., EPA, FDA)
- Investors and Venture Capitalist Firms
- Agricultural Sector Stakeholders
- Oil & Gas Industry Operators
Companies
Players Mentioned in the Report:
- Cargill, Inc.
- Morton Salt, Inc.
- Compass Minerals International, Inc.
- K+S North America Corporation
- American Rock Salt Company LLC
- United Salt Corporation
- Detroit Salt Company
- Kissner Group Holdings LP
- Tata Chemicals North America Inc.
- Redmond, Inc.
Table of Contents
1. U.S. Salt Market Overview
1.1. Definition and Scope
1.2. Market Taxonomy
1.3. Market Growth Rate
1.4. Market Segmentation Overview
2. U.S. Salt Market Size (In USD Billion)
2.1. Historical Market Size
2.2. Year-On-Year Growth Analysis
2.3. Key Market Developments and Milestones
3. U.S. Salt Market Analysis
3.1. Growth Drivers
3.1.1. Industrial Applications (Chemical Processing, De-icing)
3.1.2. Food Industry Demand
3.1.3. Agricultural Uses
3.1.4. Water Treatment Needs
3.2. Market Challenges
3.2.1. Environmental Regulations
3.2.2. Fluctuating Raw Material Costs
3.2.3. Competition from Substitute Products
3.3. Opportunities
3.3.1. Technological Advancements in Production
3.3.2. Expansion into Emerging Applications
3.3.3. Strategic Partnerships and Collaborations
3.4. Trends
3.4.1. Shift Towards Organic and Gourmet Salts
3.4.2. Sustainable Mining Practices
3.4.3. Increased Use in Health and Wellness Products
3.5. Government Regulations
3.5.1. FDA Guidelines on Salt Consumption
3.5.2. Environmental Protection Agency (EPA) Standards
3.5.3. State-Level Mining and Production Regulations
3.6. SWOT Analysis
3.7. Stakeholder Ecosystem
3.8. Porters Five Forces Analysis
3.9. Competitive Landscape
4. U.S. Salt Market Segmentation
4.1. By Product Type (In Value %)
4.1.1. Rock Salt
4.1.2. Solar Salt
4.1.3. Vacuum Pan Salt
4.1.4. Brine
4.2. By Application (In Value %)
4.2.1. Chemical Processing
4.2.2. De-icing
4.2.3. Food Processing
4.2.4. Agriculture
4.2.5. Water Treatment
4.2.6. Oil & Gas
4.2.7. Others
4.3. By Source (In Value %)
4.3.1. Brine
4.3.2. Salt Mines
4.4. By Distribution Channel (In Value %)
4.4.1. Direct Sales
4.4.2. Distributors
4.4.3. Online Retail
4.5. By Region (In Value %)
4.5.1. Northeast
4.5.2. Midwest
4.5.3. South
4.5.4. West
5. U.S. Salt Market Competitive Analysis
5.1. Detailed Profiles of Major Companies
5.1.1. Cargill, Inc.
5.1.2. Morton Salt, Inc.
5.1.3. Compass Minerals International, Inc.
5.1.4. K+S North America Corporation
5.1.5. American Rock Salt Company LLC
5.1.6. Detroit Salt Company
5.1.7. United Salt Corporation
5.1.8. Kissner Group Holdings LP
5.1.9. North American Salt Company
5.1.10. Redmond, Inc.
5.1.11. US Salt LLC
5.1.12. Salins Group
5.1.13. Tata Chemicals North America Inc.
5.1.14. Akzo Nobel Salt, Inc.
5.1.15. Dominion Salt Ltd.
5.2. Cross Comparison Parameters (Revenue, Production Capacity, Market Share, Product Portfolio, Geographic Presence, R&D Investment, Strategic Initiatives, Number of Employees)
5.3. Market Share Analysis
5.4. Strategic Initiatives
5.5. Mergers and Acquisitions
5.6. Investment Analysis
5.7. Venture Capital Funding
5.8. Government Grants
5.9. Private Equity Investments
6. U.S. Salt Market Regulatory Framework
6.1. Environmental Standards
6.2. Compliance Requirements
6.3. Certification Processes
7. U.S. Salt Market Future Projections (In USD Billion)
7.1. Future Market Size Projections
7.2. Key Factors Driving Future Market Growth
8. U.S. Salt Market Future Segmentation
8.1. By Product Type (In Value %)
8.2. By Application (In Value %)
8.3. By Source (In Value %)
8.4. By Distribution Channel (In Value %)
8.5. By Region (In Value %)
9. U.S. Salt Market Analysts Recommendations
9.1. Total Addressable Market (TAM), Serviceable Available Market (SAM), and Serviceable Obtainable Market (SOM) Analysis
9.2. Customer Cohort Analysis
9.3. Marketing Initiatives
9.4. White Space Opportunity Analysis
Disclaimer
Contact Us
Research Methodology
Step 1: Identification of Key Variables
This phase involves mapping all major stakeholders in the U.S. Salt Market. Desk research and proprietary databases are utilized to gather relevant market-level information, focusing on production volumes, demand drivers, and key applications.
Step 2: Market Analysis and Construction
Comprehensive historical data on market size, segmentation, and revenue generation is compiled. Statistical models and trends are analyzed to ensure data reliability and consistency.
Step 3: Hypothesis Validation and Expert Consultation
Hypotheses are developed and validated through consultations with industry experts, including producers, distributors, and end-users. Their insights ensure accuracy in understanding market dynamics.
Step 4: Research Synthesis and Final Output
The final report synthesizes qualitative and quantitative data, providing an in-depth analysis of the U.S. Salt Market, its key segments, and future trends.
Frequently Asked Questions
01. How big is the U.S. Salt Market?
The U.S. Salt Market is valued at USD 4.15 billion, driven by the increasing demand across industries like food processing, de-icing, and chemical manufacturing.
02. What are the challenges in the U.S. Salt Market?
Challenges in the U.S. Salt Market include stringent environmental regulations, fluctuating raw material costs, and competition from substitute products like chemical de-icers.
03. Who are the major players in the U.S. Salt Market?
Key players in the U.S. Salt Market include Cargill, Inc., Morton Salt, Inc., Compass Minerals International, Inc., and K+S North America Corporation, leveraging advanced mining and production technologies.
04. What are the growth drivers of the U.S. Salt Market?
Growth of U.S. Salt Market is propelled by increased demand for processed food, infrastructure development, and its critical role in chemical processing and water treatment.
Why Buy From Us?

What makes us stand out is that our consultants follows Robust, Refine and Result (RRR) methodology. i.e. Robust for clear definitions, approaches and sanity checking, Refine for differentiating respondents facts and opinions and Result for presenting data with story

We have set a benchmark in the industry by offering our clients with syndicated and customized market research reports featuring coverage of entire market as well as meticulous research and analyst insights.

While we don't replace traditional research, we flip the method upside down. Our dual approach of Top Bottom & Bottom Top ensures quality deliverable by not just verifying company fundamentals but also looking at the sector and macroeconomic factors.

With one step in the future, our research team constantly tries to show you the bigger picture. We help with some of the tough questions you may encounter along the way: How is the industry positioned? Best marketing channel? KPI's of competitors? By aligning every element, we help maximize success.

Our report gives you instant access to the answers and sources that other companies might choose to hide. We elaborate each steps of research methodology we have used and showcase you the sample size to earn your trust.

If you need any support, we are here! We pride ourselves on universe strength, data quality, and quick, friendly, and professional service.